Graphic statistics, analytics and reports for K2
![]()
Content Statistics provides integration to record and display statistics and rankings for K2 component, one of the top used article extensions for Joomla!
Content Statistics for Joomla works perfectly integrated with K2, offering you the possibility to display all kind of data and make all sort of reports of your K2 content statistics. Make graphics of the popularity of your K2 items, itemlists, autor pages (blog layout), tag lists and more. Show rankings of your K2 items in any imaginable period of time, see what's hot on your site.
Content Statistics for K2 goes beyond the simple "number of hits" feature, which is a total count and does not tell you the evolution of your items. With this plugin, you can extend this functionality by adding the "time" variable: how many users saw this content in last hour? and in last day? and in the month of October? which are the top articles by a specific autor? what are the most visualized tags? what are the most commented or voted articles inside the current category and its children categories within the last 2 weeks? How did this article evolved last week?
With Statistics and Rankings for K2, the possibilities are endless. There are so many options that you won't find a thing you can't show... and yet is so simple to use and configure. You don't need any developer skills or even be very familiar with Joomla, Content Statistics is incredible easy to use. You can now make as many reports as you want, and make them very specific or just global to see a big picture of what users watch and read in your K2 site.
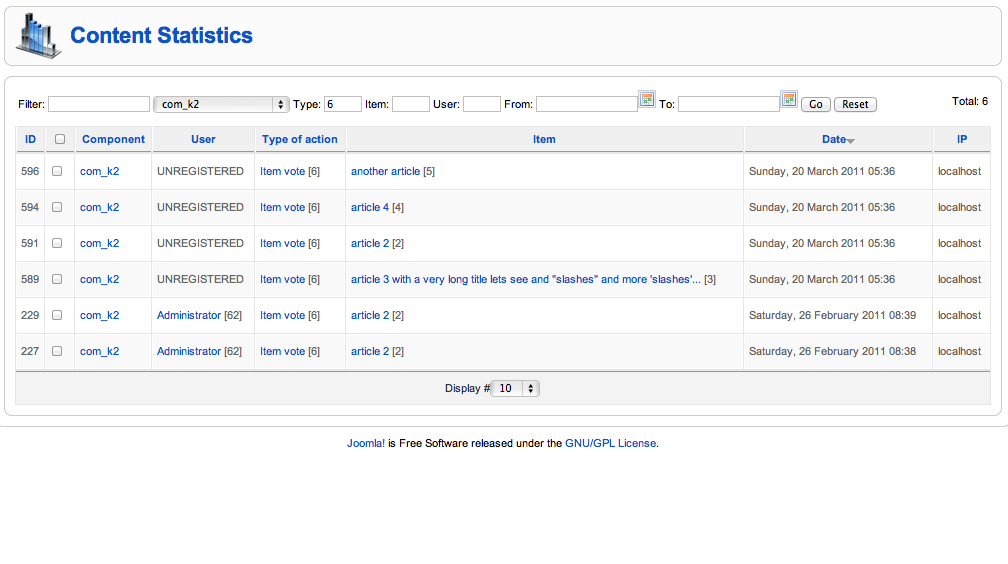
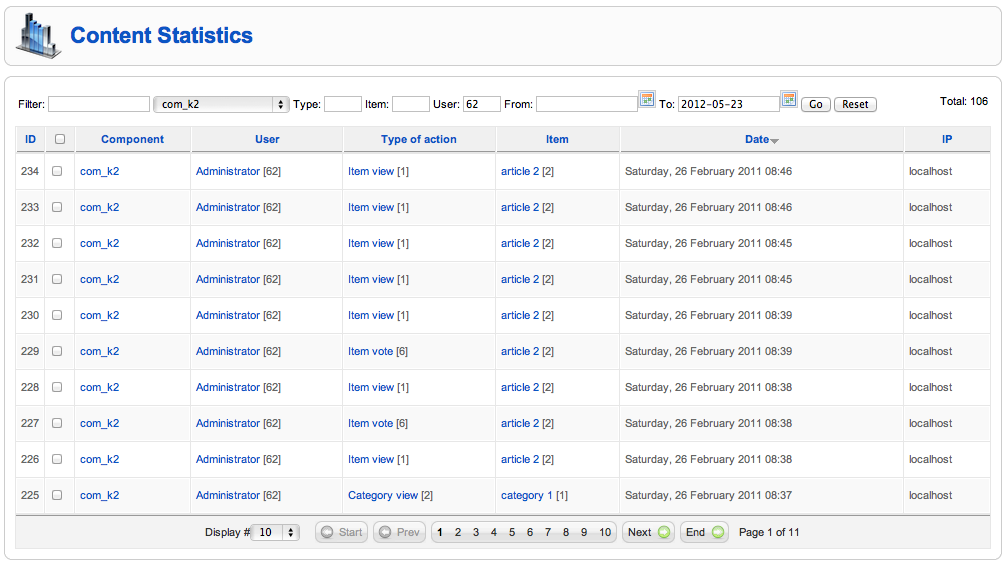
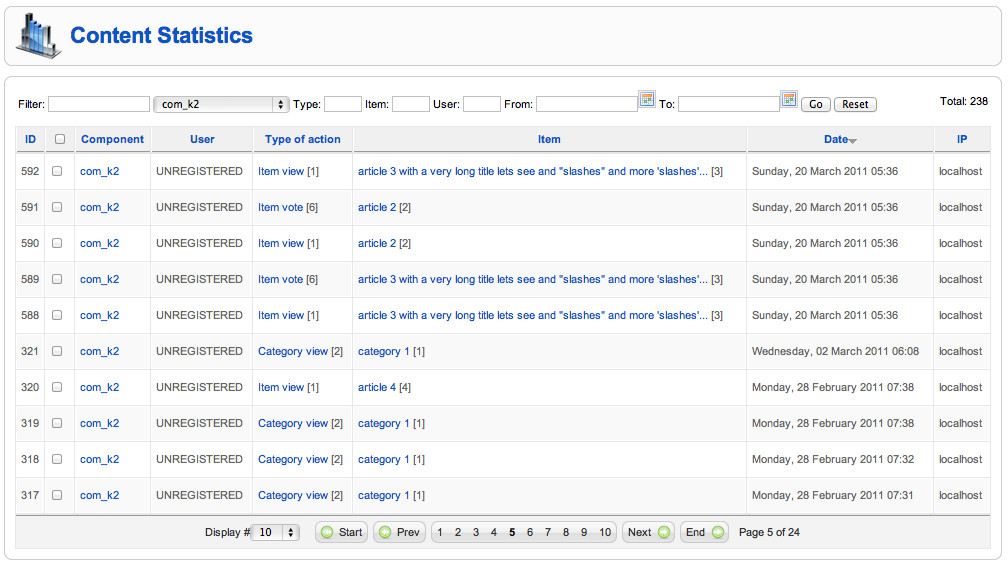
Complete user activity log reports for admins in the backend
With our Extended version you will be able to have a detailed full activity stream for K2 to know exactly everything that your users are doing. How did what, and when? What articles did John Smith read last month? how many times? With the full activity log reports you can see all the user activity stream for K2 and have partial or full time count reports. You can filter results by date range, component, type of action, specific item, specific user.
- Item views
- Category views
- Tag page views
- Author page views
- Attachment downloads
- Item vote
- Item creation
- Item edit
Popularity Rankings for K2
This plugin extends the functionality of the Rankings Module to allow you to make rankings on your K2 items.
Make rankings of:
- Top viewed articles
- Top viewed categories
- Top viewed tags
- Top viewed autor pages (blogs)
- Top commented articles
- Most voted articles (optional: define a rating)
- Top downloaded attachments
Combine the list above with any of the possible filters:
- Current category articles
- Current category (and its children categories) articles
- Current tag articles
- Current autor articles
- Current item attachments
- Specific category articles
- Specific category (and its children categories) articles
- Specific tag articles
- Specific autor articles
- Specific item attachments
- All category/article/tag/autor (equivalent to no filter)
Additionally, optionaly filter by user options:
- Current vieweing user (actions done only by that user)
- Specific user (actions done only by that user)
And, of course, combine the two lists above selecting your desired timeframe, in the "relative time" mode:
- Last hour
- Last 6 hours
- Last 12 hours
- Last day
- Last 3 days
- Last 5 days
- Last week
- Last 2 weeks
- Last month
- Last 6 months
- Last year
- All time
Or in the "absolute time" mode:
- Today
- Yesterday
- This week
- Last week
- This month
- Last month
- This year
- Last year
As you can see, the possibilities to make Rankings for K2 items and itemlists are infinite.
Ranking examples for K2 using Content Statistics
Item evolution reports for K2
This plugin extends the functionality of the Item Evolution Module to allow you to show the evolution of your K2 items.
Show evolution of:
- Article views
- Category itemlist views
- Tag itemlist views
- Autor itemlist views
- Article comments
- Article votes
- Attachment downloads
Combine the list above with any of the possible filters:
- Current category/article/tag/autor being shown
- Current category to which current article belongs
- Current category (and its children categories) to which current article belongs
- Current autor to which current article belongs
- Specific category/article/tag/autor
- Specific category to which current article belongs
- Specific category (and its children categories) to which current article belongs
- Specific autor to which current article belongs
- All category/article/tag/autor (equivalent to no filter)
Additionally, optionaly filter by user options:
- Current vieweing user (actions done only by that user)
- Specific user (actions done only by that user)
And, of course, combine the two lists above selecting your desired timeframe, to complete the chart's x-axis to show the items evolution:
- Last X days (define the number of days you want to consider)
- Last X months (define the number of months you want to consider)
Once more, the possibilities to make item evolution charts for K2 items and itemlists are endless.
Item Evolution examples for K2 using Content Statistics
| {{ col.label }} | |
|---|---|
| {{ row }} | {{ col.data[rowindex] | cs_format(col.before, col.after, col.decimals) }} |
| {{ chart.rowTotal(index) | cs_format(col.before, col.after, col.decimals) }} |
You can use all our graphic options to make graphics, for instance column charts:
| {{ col.label }} | |
|---|---|
| {{ row }} | {{ col.data[rowindex] | cs_format(col.before, col.after, col.decimals) }} |
| {{ chart.rowTotal(index) | cs_format(col.before, col.after, col.decimals) }} |
Visitor maps for K2
Know where your K2 visitors come from and draw beautiful maps to see where your content is more accessed from