Graphic statistics, analytics and reports for HikaShop

Content Statistics provides integration to record and display statistics and analytics for HikaShop. Track the top products, see your profits in nice graphics, know who and when is creating, editing or deleting products...
Content Statistics for Joomla works perfectly integrated with HikaShop, offering you the possibility to display all kind of data and make all sort of reports of your HikaShop products, sales and other statistics. Make graphics of the popularity of your HikaShop products, sales... Show rankings of your HikaShop items in any period of time, see what's hot on your site, see how much revenue each of your products generate, or just see an overall report of how money you make on your site by week, month, day...
Content Statistics for HikaShop goes beyond the simple "number of hits" feature, which is a total count and does not tell you the evolution of your items. With this plugin, you can extend this functionality by adding the "time" variable
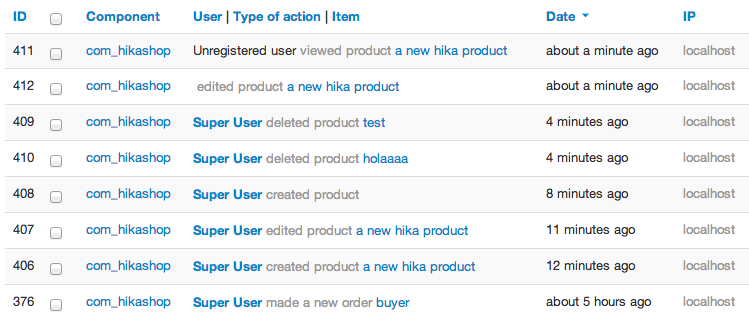
Complete user activity log reports for admins in the backend for HikaShop
With our Extended version you will be able to have a detailed full activity stream for HikaShop to know exactly everything that your users are doing. How did what, and when? Who edited a certain item? With the full activity log reports you can see all the user activity stream for HikaShop and have partial or full time count reports. You can filter results by date range, component, type of action, specific item, specific user. You can see full product activity that happened on the frontend, or in the backend (actions made by your administrators or manager), such as:
- Product views
- Product creation
- Product edition
- Delete product
- Order confirmed
- Order edited
 Click on the image to enlarge
Popularity Rankings for HikaShop
Make rankings of:
- Top viewed products
- Top purchased products
- Top grossing products
Combine the list above with any of the possible filters:
- Current category products
- Current category (and its children categories) products
- Specific category products
- Specific category (and its children categories) products
- All category/products (equivalent to no filter)
Additionally, optionaly filter by user options:
- Current vieweing user (actions done only by that user)
- Specific user (actions done only by that user)
And, of course, combine the two lists above selecting your desired timeframe, in the "relative time" mode:
- Last hour
- Last 6 hours
- Last 12 hours
- Last day
- Last 3 days
- Last 5 days
- Last week
- Last 2 weeks
- Last month
- Last 6 months
- Last year
- All time
Or in the "absolute time" mode:
- Today
- Yesterday
- This week
- Last week
- This month
- Last month
- This year
- Last year
As you can see, the possibilities to make Rankings for HikaShop products are endless. Give your e-commerce site a professional touch adding statistics and reports on your products!
Ranking examples for HikaShop using Content Statistics
Product evolution reports for HikaShop
Show evolution of:
- Product views
- Number of Orders
- Order grossing
Combine the list above with any of the possible filters:
- Current product being shown
- Current category
- Current category (and its children categories)
- Specific category/product
- Specific category
- Specific category (and its children categories)
- All category (equivalent to no filter)
Additionally, optionaly filter by user options:
- Current vieweing user (actions done only by that user)
- Specific user (actions done only by that user)
And, of course, combine the two lists above selecting your desired timeframe, to complete the chart's x-axis to show the items evolution:
- Last X days (define the number of days you want to consider)
- Last X months (define the number of months you want to consider)
Once more, the possibilities to make item evolution charts for HikaShop products are endless.
Item Evolution examples for HikaShop products using Content Statistics
| {{ col.label }} | |
|---|---|
| {{ row }} | {{ col.data[rowindex] | cs_format(col.before, col.after, col.decimals) }} |
| {{ chart.rowTotal(index) | cs_format(col.before, col.after, col.decimals) }} |
You can use all our graphic options to make graphics, for instance column charts:
| {{ col.label }} | |
|---|---|
| {{ row }} | {{ col.data[rowindex] | cs_format(col.before, col.after, col.decimals) }} |
| {{ chart.rowTotal(index) | cs_format(col.before, col.after, col.decimals) }} |
Visitor maps for HikaShop
Know where your HikaShop visitors come from and draw beautiful maps to see where your content is more accessed from